使用期限租赁或永久
许可形式单机和网络版
原产地美国
介质下载
适用平台window,mac,linux
科学软件网提供的软件覆盖各个学科,软件数量达1000余款,满足各高校和企事业单位的科研需求。此外,科学软件网还提供软件培训和研讨会服务,目前视频课程达68门,涵盖34款软件。
summarize displays the mean and standard deviation of a variable across observations; program
writers can access the mean in r(mean) and the standard deviation in r(sd) (see [R] summarize).
egen’s rowmean() function creates the means of observations across variables. rowmedian() creates
the medians of observations across variables. rowpctile() returns the #th percentile of the variables
specified in varlist. rowsd() creates the standard deviations of observations across variables.
rownonmiss() creates a count of the number of nonmissing observations, the denominator of the
rowmean() calculation

You can model categorical outcomes with mlogit.

anyvalue(), anymatch(), and anycount() are for categorical or other variables taking integer
values. If we define a subset of values specified by an integer numlist (see [U] 11.1.8 numlist),
anyvalue() extracts the subset, leaving every other value missing; anymatch() defines an indicator
variable (1 if in subset, 0 otherwise); and anycount() counts occurrences of the subset across a set
of variables. Therefore, with one variable, anymatch(varname) and anycount(varname) are
equivalent.
With the auto dataset, we can generate a variable containing the high values of rep78 and a
variable indicating whether rep78 has a high value:

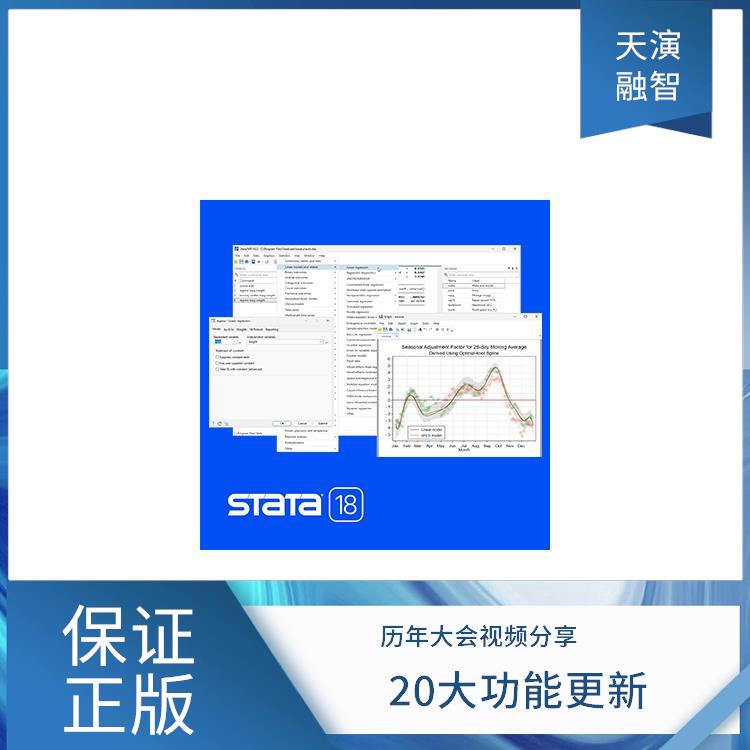
Stata 数据管理统计绘图软件
快速,简单并易于使用
点击式的界面和强大,直观的命令语言让Stata使用起来快速,并易于使用。
所有的分析结果都可以被复制和存档,并用来出版和审查。不管您什么时候写的内容,版本控制系统确保统计程序可
继续生成同样的结果。
统计功能介绍
Stata使得大量的统计工具用于指尖
● 基本表格和总结
● 案例对照分析
● ARIMA
● ANOVA 和MANOVA
● 线性回归
● 时间序列平滑
● 多层模型
● 生存分析
● 动态面板数据回归
● 结构方程建模
● 二进制,计数和审查结果
● ARCH
■ 标准方法,如■ 方法,如
● 多重替代法
● 调查数据
● Treatment effects
● 统计
● 贝叶斯分析
● ……
科学软件网的客户涵盖产品涵盖教育、、交通、通信、金融、保险、电力等行业,并且为诸如北京大学、清华大学、中国大学、中科院、农科院、社科院、环科院、国家、交通部、南方电网、国家电网、许继、南瑞等国内大型企事业单位、部委和科研机构长期提供相关产品。我们的品质,值得您信赖。
http://www.kxrjsoft.com.cn


